
The PROBoter software framework
Part V of the PROBoter blog post series
July 10, 2023
The lastpart of the PROBoter series showed how innovative algorithms can help an embeddedsystempenetrationtester to analyze recorded voltage signals of an unknown PCB. Besides basic signal characteristics, these algorithms can link signal lines and identify communication buses typically found on PCBs like I2C or SPI. In this final post of the PROBoter series, we draw the big picture of the PROBoter software framework. In parallel to the release of this post, all missing services forming the framework are released on the PROBoterGithubrepo [1]. The list below gives an overview of the topics covered in this blog post series.
- PROBoterdemovideo
- PartI:IntroducingaplatformforautomatedPCBanalysis
- PartII:Thehardwareplatform
- PartIII:VisualPCBanalysiswithNeuralNetworksandclassicComputerVisionalgorithms
- PartIV:Automatedvoltagesignalanalysisandprotocolidentification
- PartV:ThePROBotersoftwareframework
Platform design vs. Software architecture
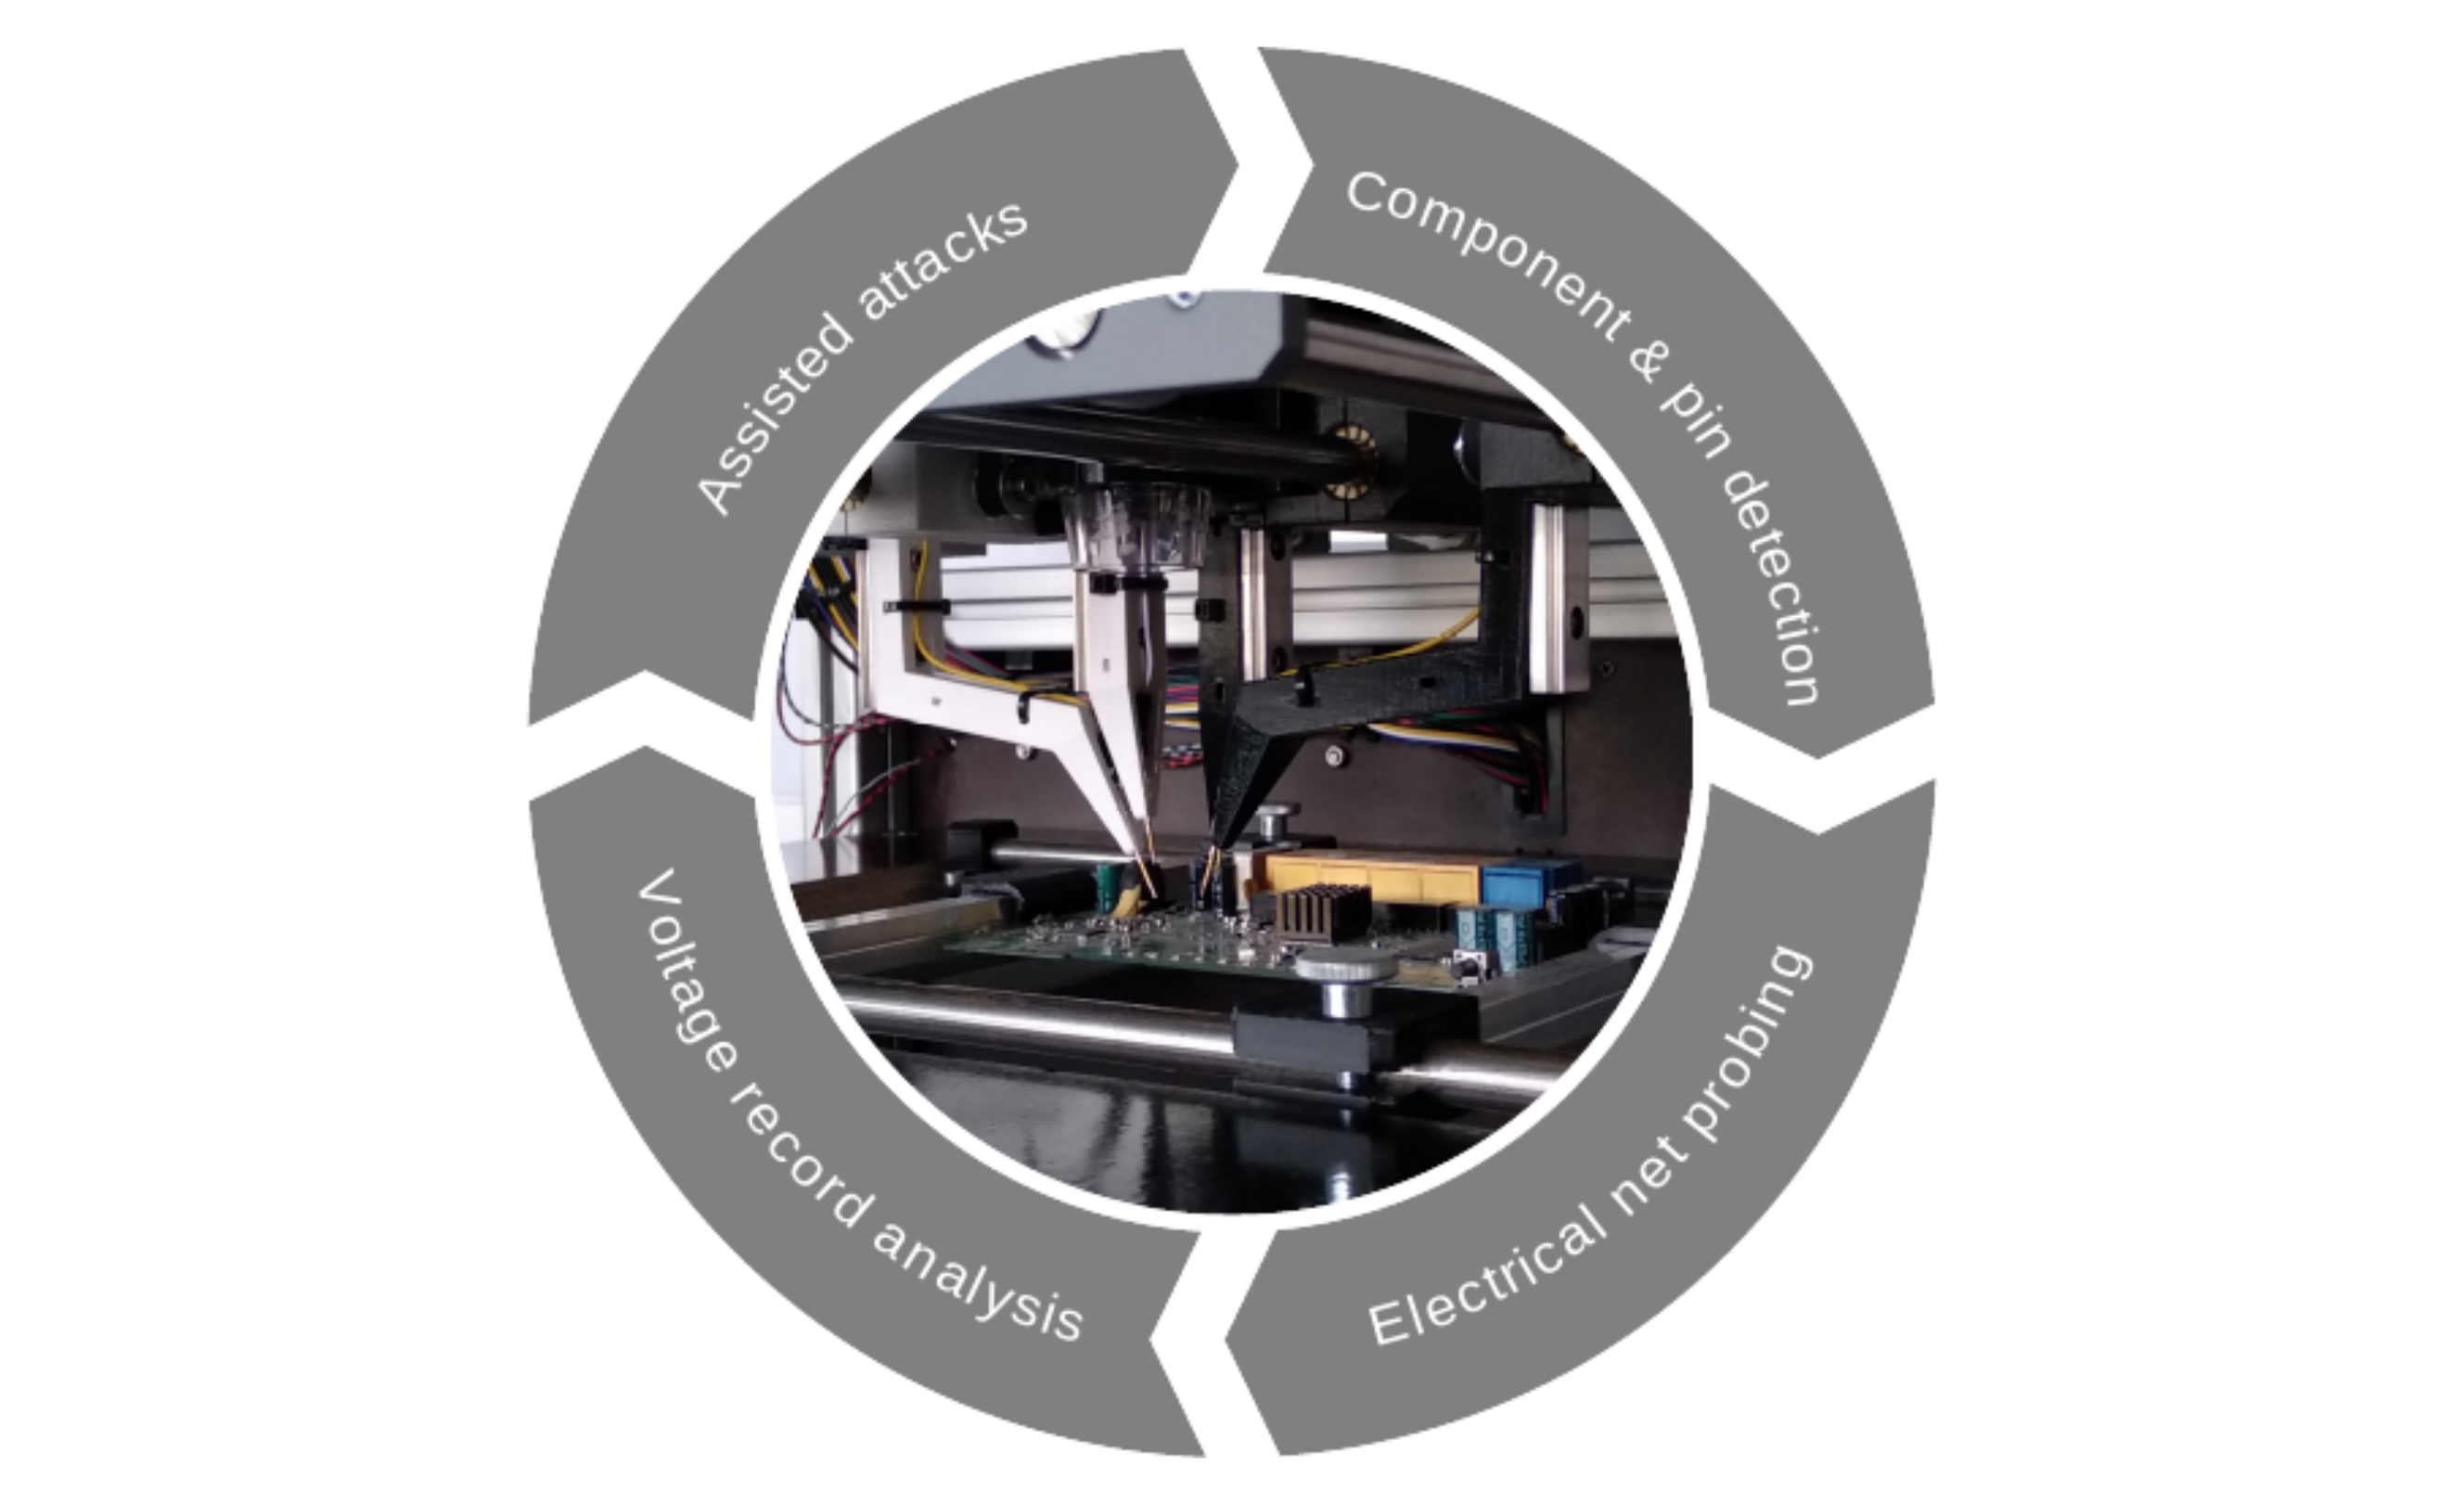
The main design goal of the PROBoter platform is to assist security analysts throughout the whole process of an embeddedsystempenetrationtest . Right from the beginning, the main focus was the development of a hardwareplatform that assists an analyst by automating manual electrical probing tasks. This lead to the hardware-centered platform design shown in the image below. Additional services, like visualanalysisofPCBimages or voltagesignalanalysis are grouped around data generated by the PROBoter hardware platform.
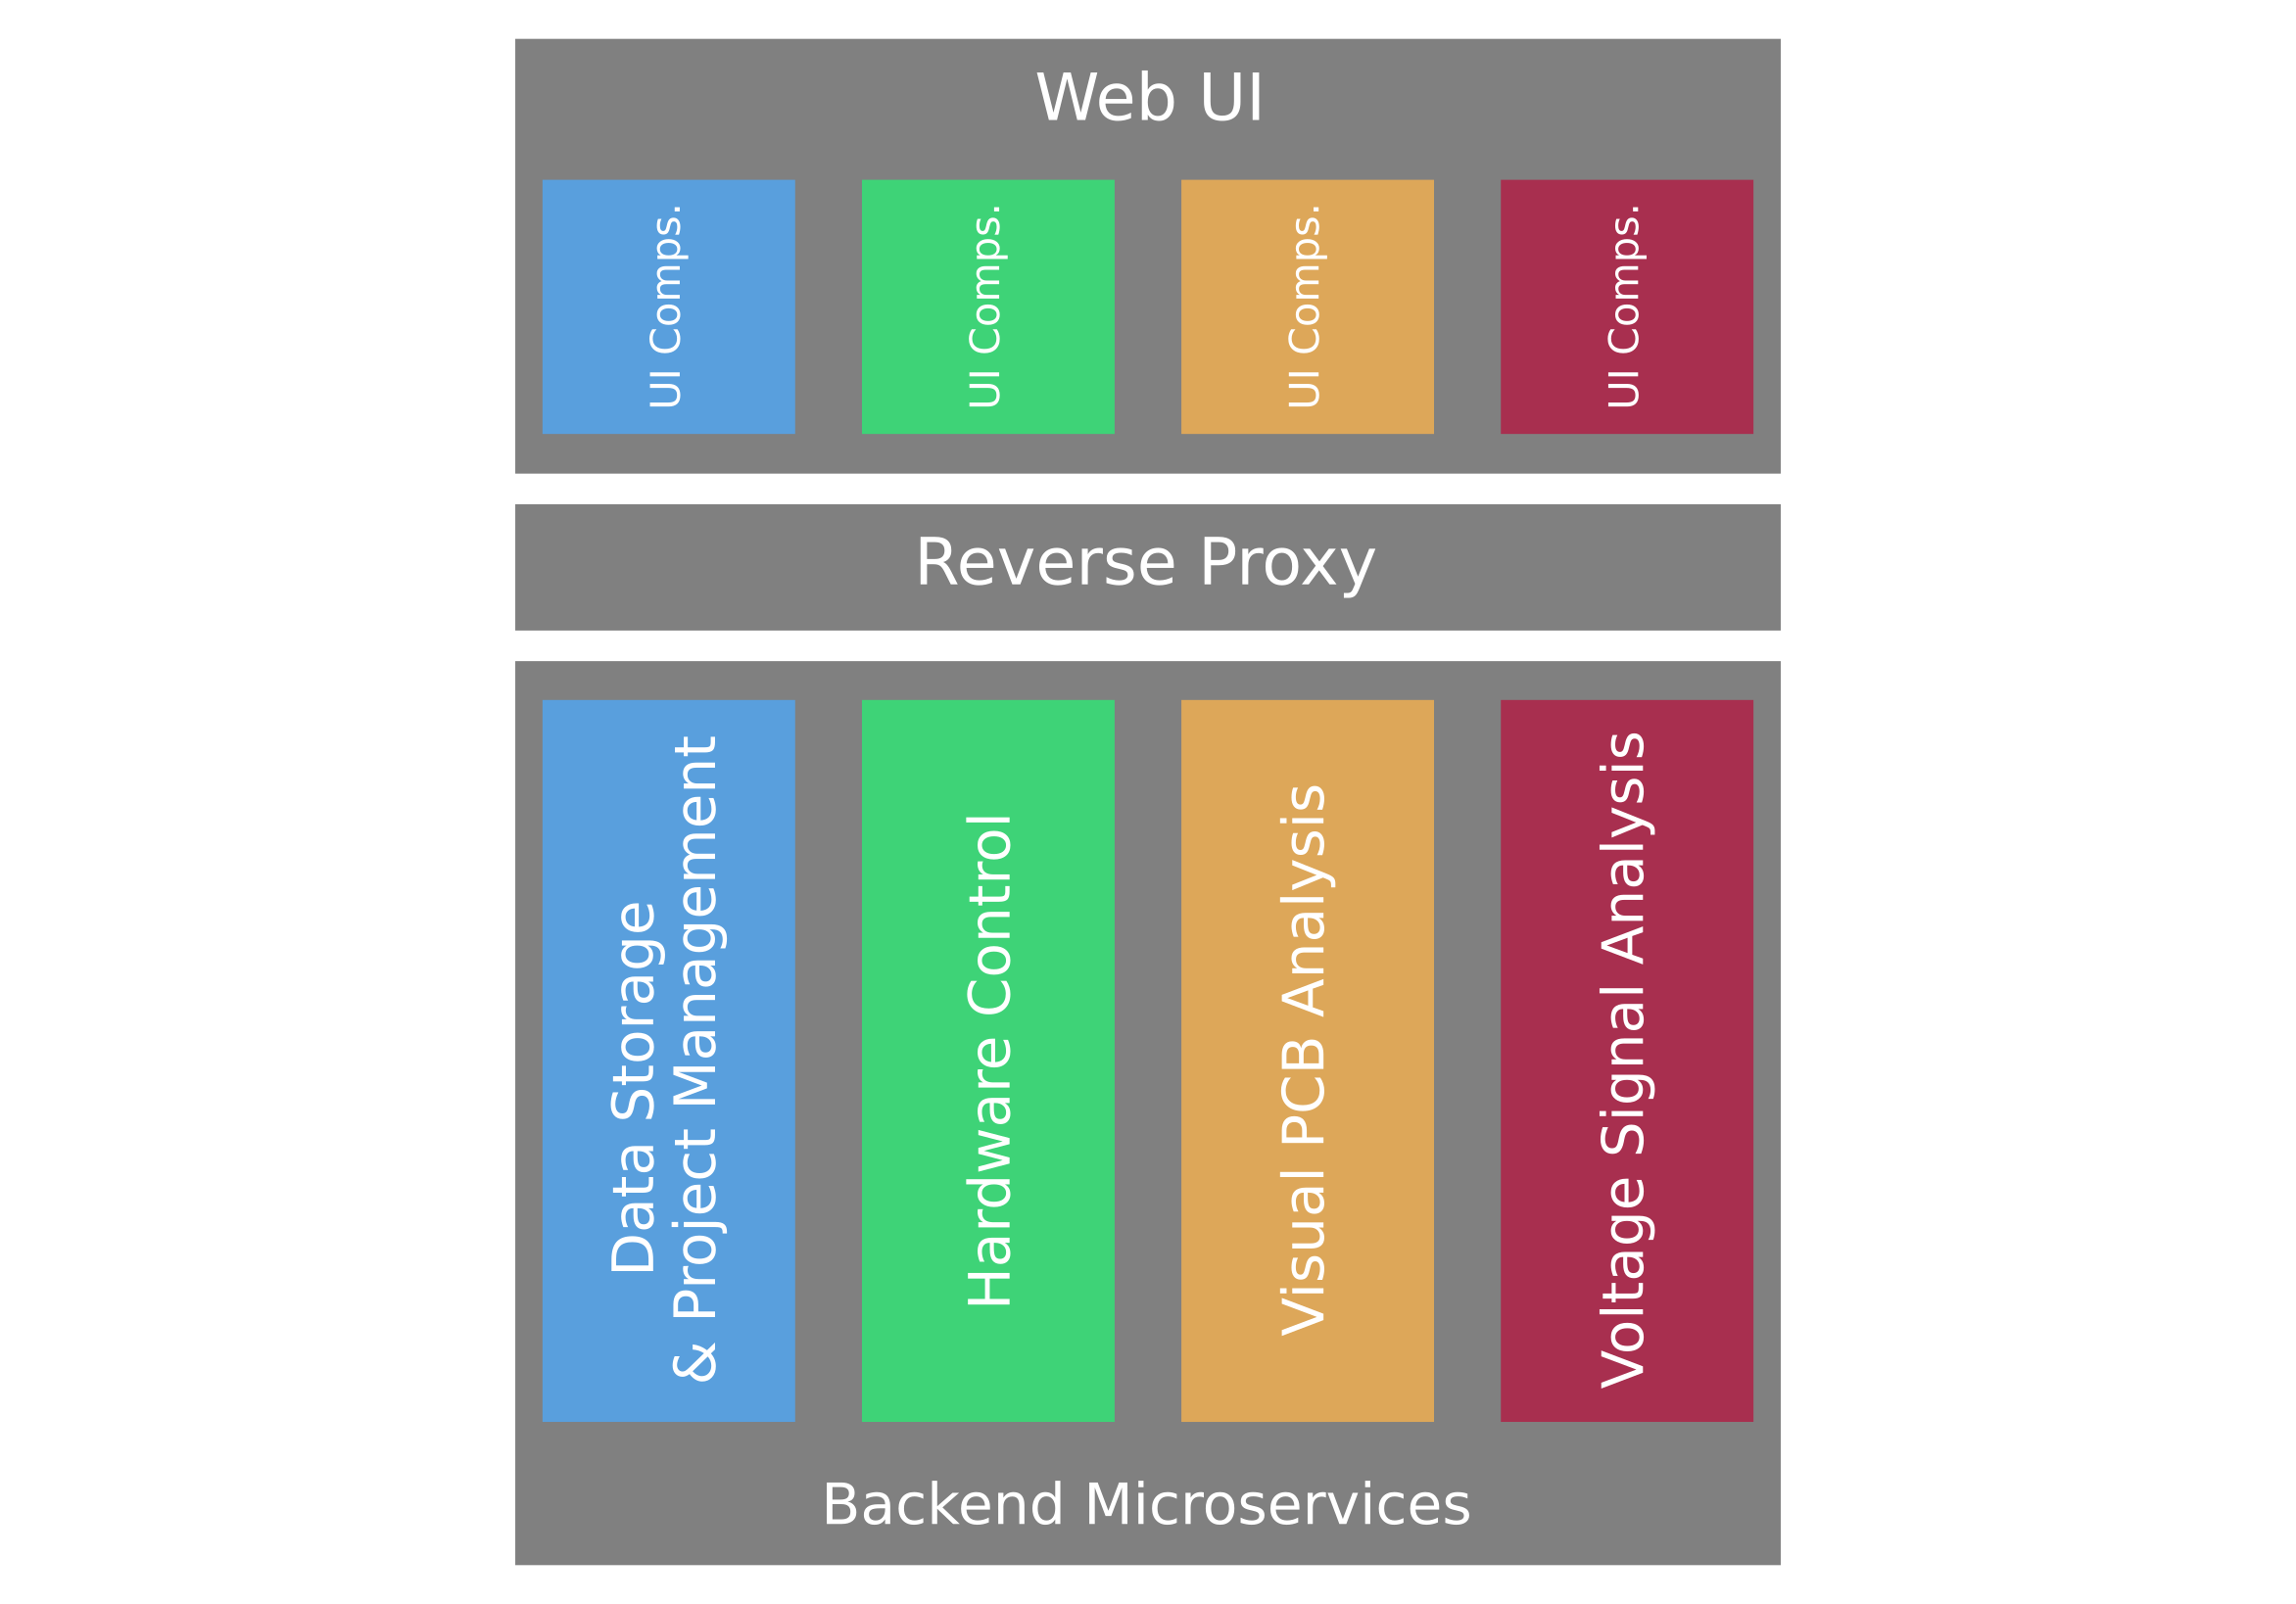
While this picture is valid from a functional point of view, the software architecture of the platform was adjusted to address another important issue: We at SCHUTZWERK know that building the PROBoter hardware platform can be quite an adventure. Therefore, we designed the PROBoter software in a way so that as many functionalities as possible can be used even if the hardware platform is not present. This way, analysts can still benefit from the project. For example, you can just use the interactive PCB editor and project management to document your analysis results and speed up your daily work. The resulting software architecture can be seen in the image below.
The individual building blocks
The base of the PROBoter software architecture is formed by a set of microservices written in Python. Each service exposes its functionality via a REST-based API to allow easy integration either in the PROBoter platform as a whole or in customized analysis workflows. Due to its asynchronous and time intensive nature, the hardware control service additionally provides a Websocket-based interface. As unified frontend, we implemented a web-based UI currently designed as Single Page Application (SPA). All backend services use either Flask [4] or its asyncio [5] equivalent Quart [6] as primary web framework. For each service, the REST API is described using Swagger [7]. All backend services are located behind a reverse proxy so that only a single port must be exposed by the system hosting the PROBoter software framework.
The user interface of the PROBoter is implemented as an SPA developed with Vue [8] and three.js [9] for 3D rendering. Even though currently designed as monolith project, UI elements and API connections have been separated into individual components that might be migrated into the corresponding backend services as Micro Frontends.
To orchestrate all of the PROBoter’s backend services and the frontend, we provide a DockerCompose [10] setup to configure and start all services with just a few terminal commands. Besides the central data storage service, the other backend microservices can be removed or included depending on your individual needs. For example, if you don’t have the PROBoter hardware platform, you can simply remove the hardware control service from the Docker Compose setup and just use the software-only analysis services.
The source code of the whole PROBoter software platform is released in the PROBoterGithubrepo under the GPLv3 license, so any contribution, participation and feedback is welcome!
What it looks like
After talking about the software architecture, the following screenshots give an impression of how the PROBoter software platform and especially the web UI looks like.
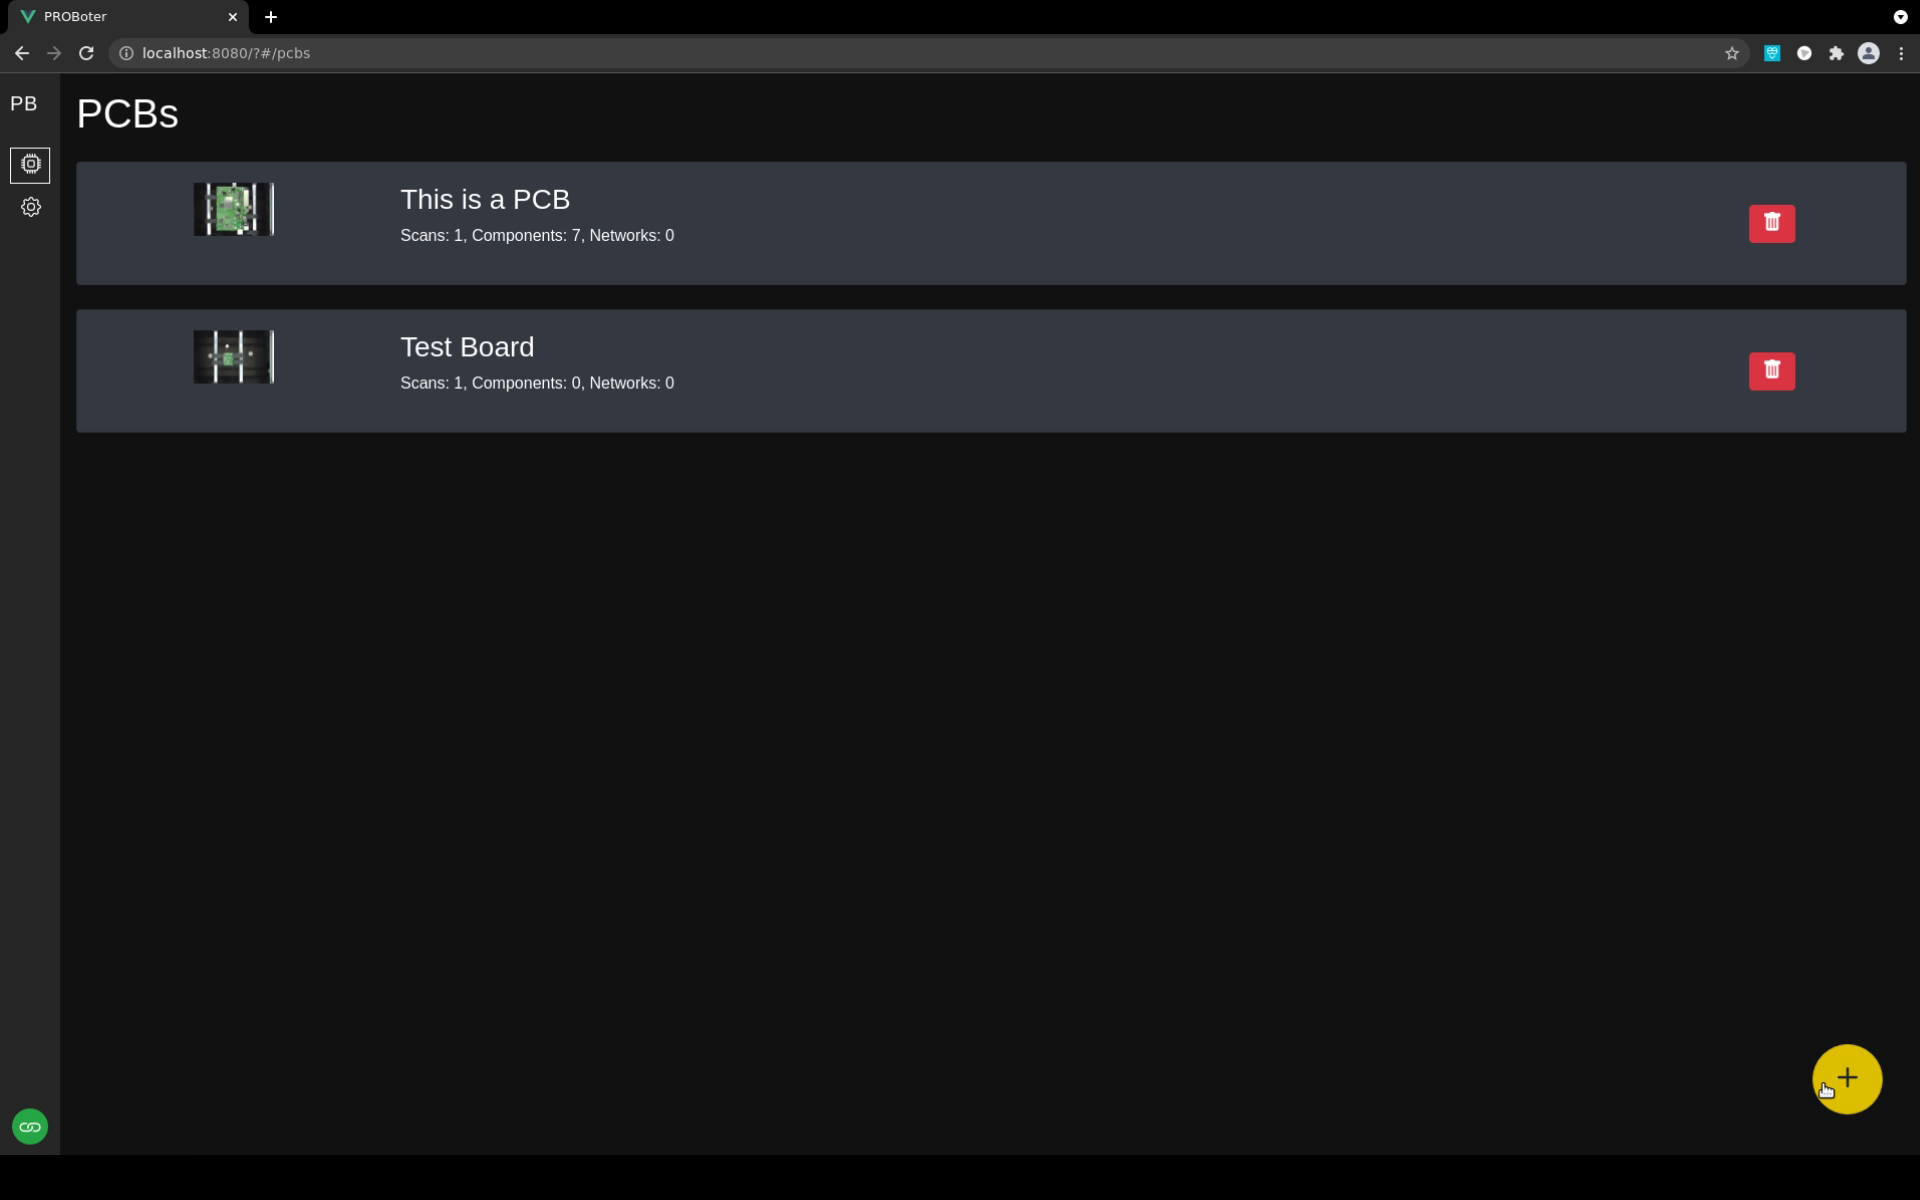
Projects are managed on a PCB level by an analyst. The respective backend logic is encapsulated in the projectanddatastoragemicroservice . The respecitve UI interface is shown in the screenshow below.
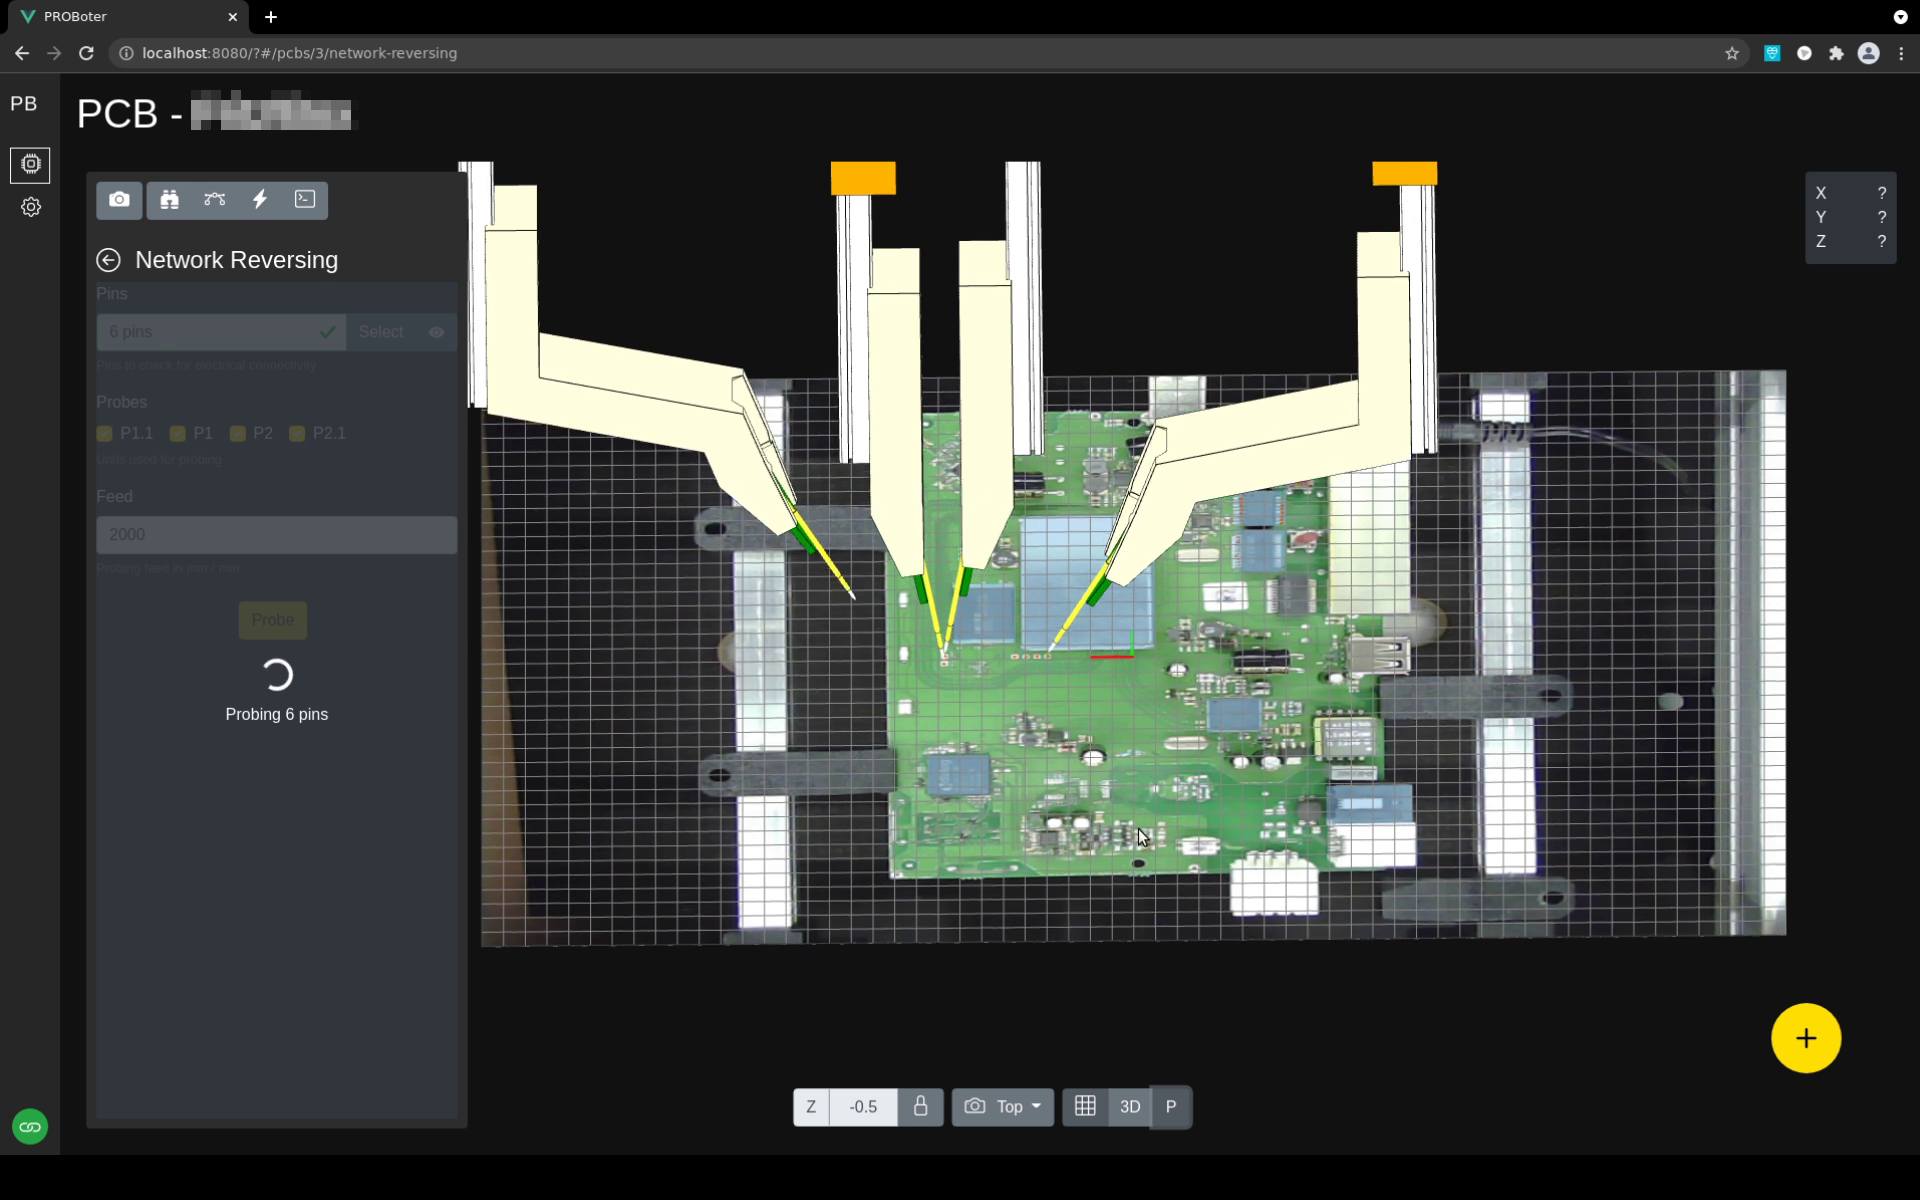
Usually, an analyst will spend most of the time working with the interactive PCB editor while inspecting an unknown PCB. The editor allows to get an overiew of the PCB under test and to manually add analysis results, like located and identified PCB components. The screenshot below shows the PCB editor rendering a live 3D model of the PROBoter hardware during an automated electrical net reversing process.
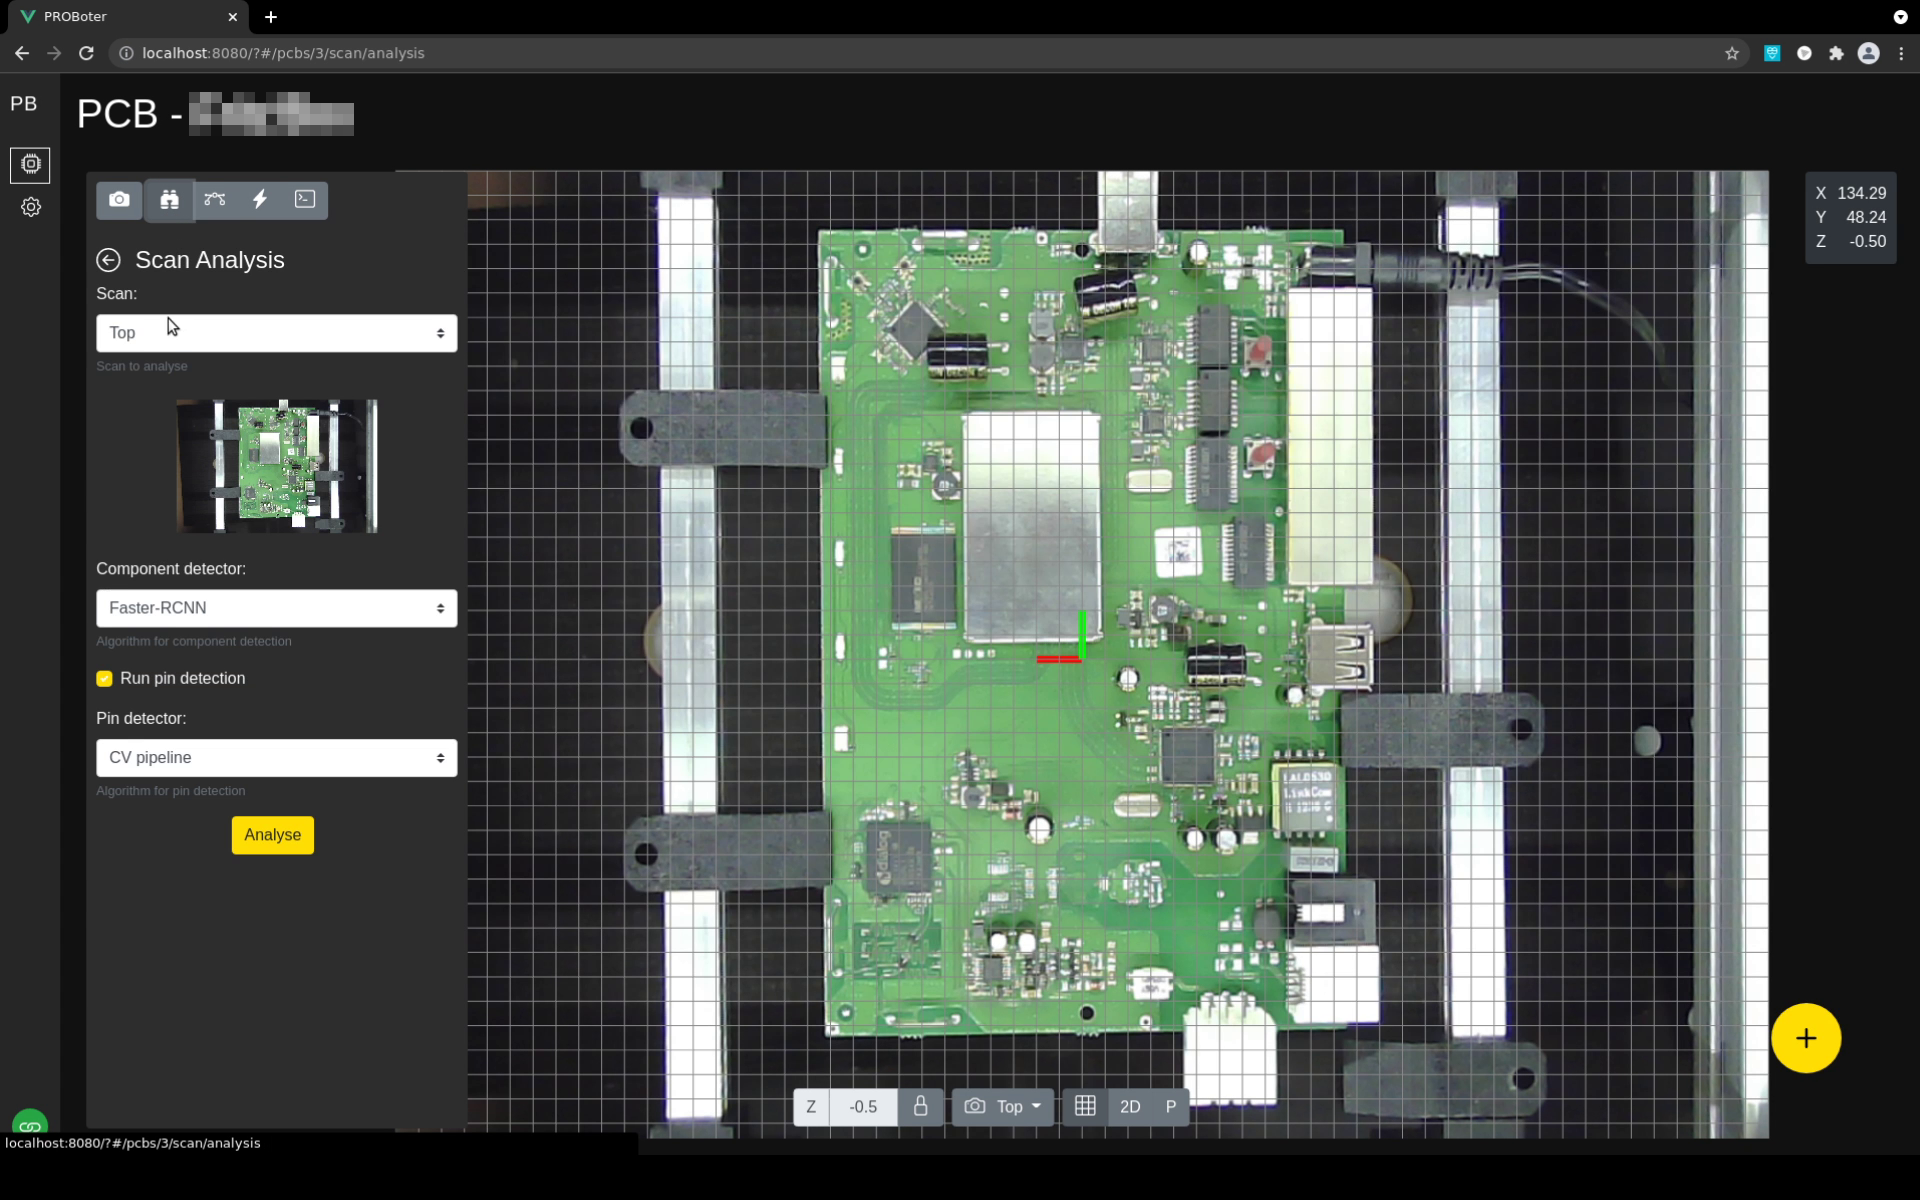
Specialized analysis functions like the one for visualPCBanalysis and voltagesignalanalysis is bundled in individual stand-alone services which have been already introduced in previous posts. This functionality is also made accessible directly in the PCB editor to allow a smooth analysis workflow.
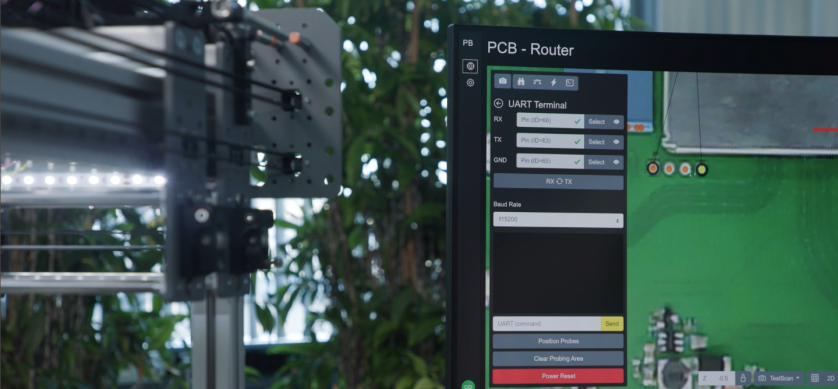
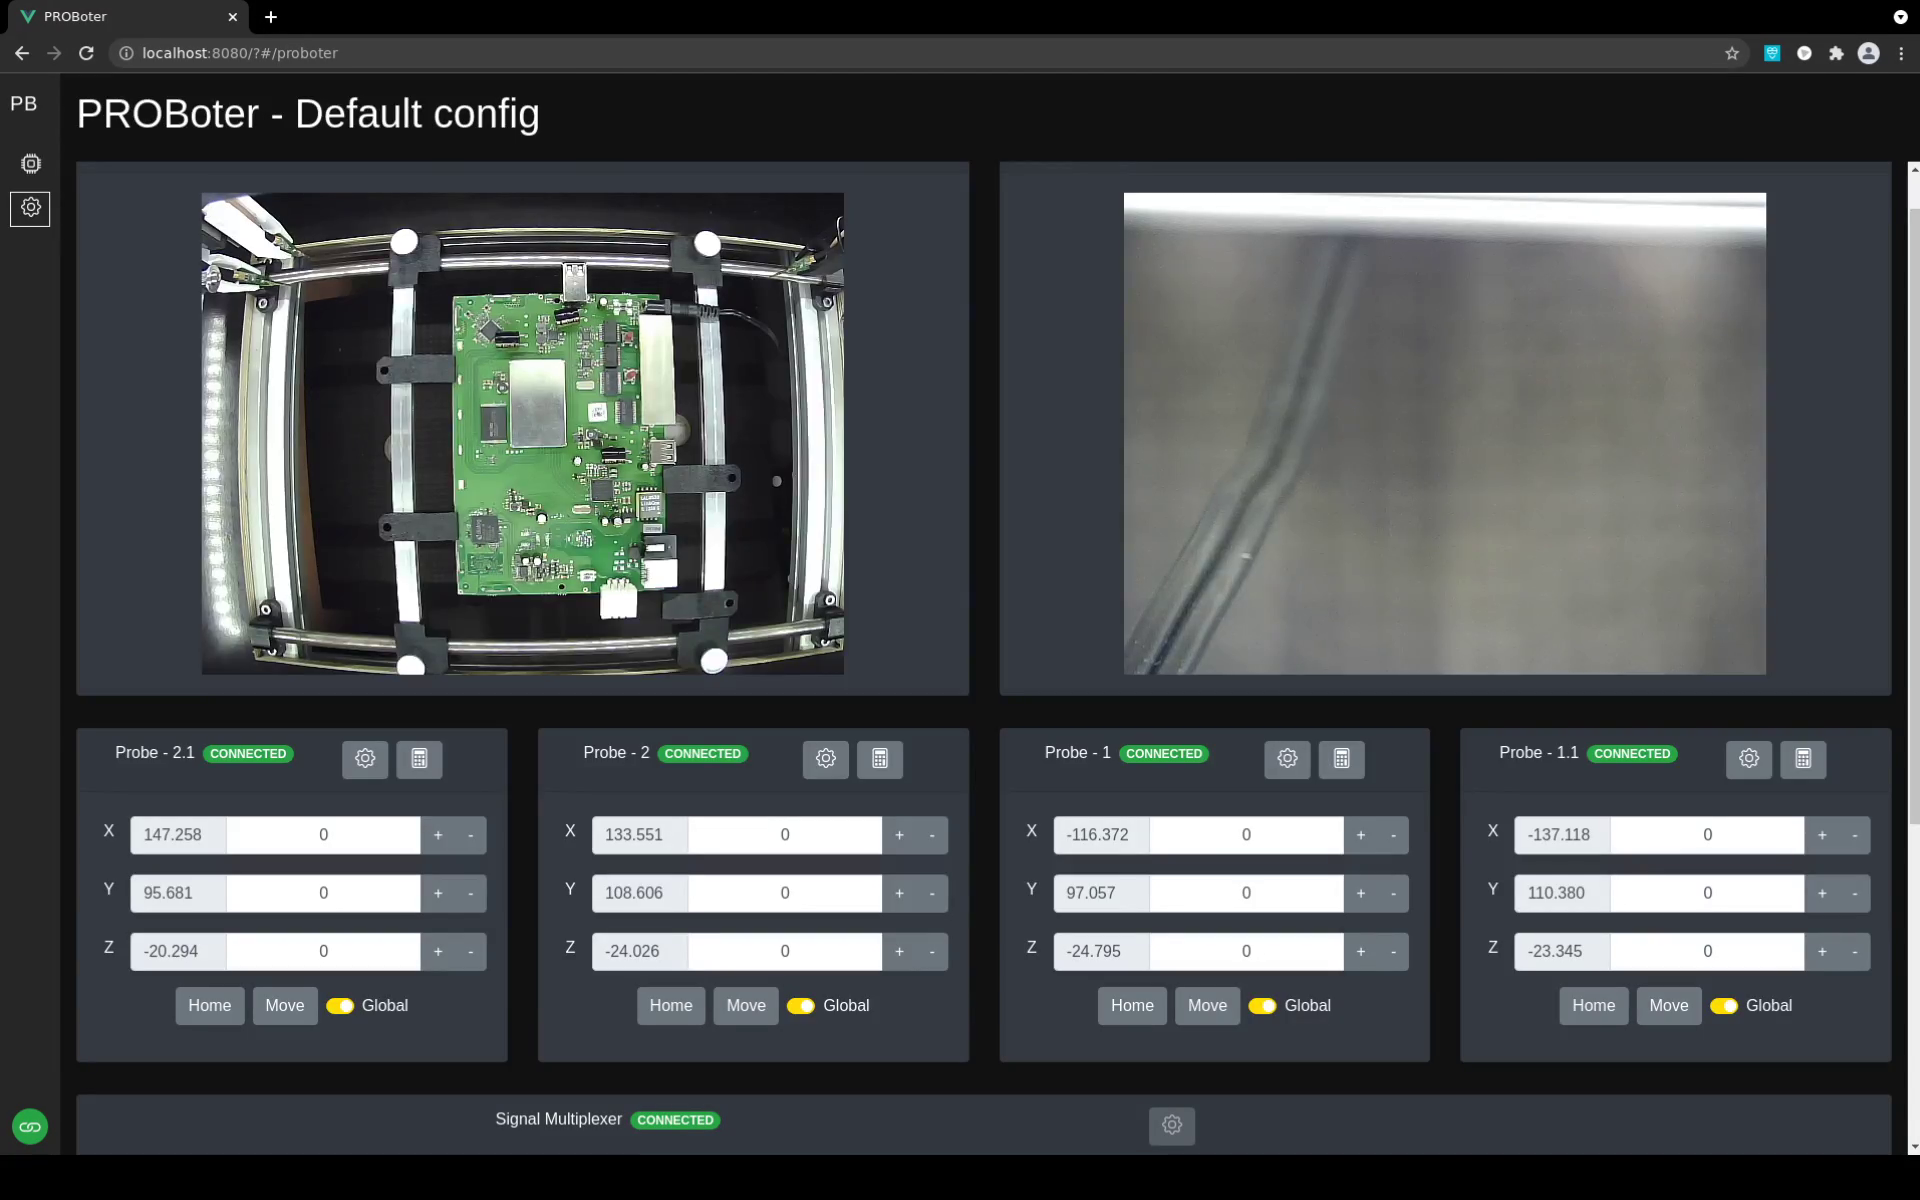
The interface to the PROBoter hardware is encapsulated in a separate hardwarecontrol microservice. Besides configuration and low-level control, this service also offers high-level analysis functionality like algorithms for electrical net reversing. This functionality is rarely used directly but is required e.g. for initial calibration and setup of the PROBoter hardware. It is therefore also integrated in the web UI as can be seen below.
Showcase
To demonstrate how all the described pieces fit together, the following video gives an impression of how an analysis workflow of an unknown PCB looks like using the PROBoter platform. It shows the inspection of a popular DSL router’s PCB from initial image generation to finally getting a root shell on the device.
The following analysis tasks are performed in the video:
- First of all, a new project for the router’s PCB is created.
- An initial image of the PCB under test is created using the low-resolution static camera system of the PROBoterhardware .
- The generated PCB image is analyzed using the Visual PCB Analysis microservice. For pin detection, the TensorFlow-based detector is used with the trained Faster R-CNN model. Pins are located using the implemented computer vision pipeline. More information can be found in the previous blog post about componentandpindetection .
- A group of test pads are manually created for automated electrical probing in the next step.
- Voltage signals are measured at the previously defined test pad locations with the PROBoter hardware and an attached oscilloscope.
- The following automatedanalysisofrecordedvoltagetraces identifies an UART communication interface on the selected test pads.
- After switching the analysis tool of the PROBoter hardware to a USB-to-UART adapter, the test pads are again automatically probed. This time, the probe signals are routed to the digital inputs of the USB-to-UART adapter.
- The embedded, interactive UART shell is used to communicate with the target under test. Because no password is set for the user root, direct access to the system with highest privileges is granted. This is also verified by the output of the
idcommand confirming the currently logged-in user isroot.
Next steps
The PROBoter platform is still under active development. We are still testing the reliability and usability of the platform in real world projects. Furthermore, we are constantly improving the assisting analysis services both for PCB image data and voltage signals.
Follow us on Twitter
, LinkedIn
, Xing
to stay up-to-date.
References / Credits
[1] PROBoterGitHubrepository
[2] PROBoterpaperDOI:10.13154/294-8348
[3] PROBoterdemovideo
[4] https://github.com/pallets/flask
[5] https://docs.python.org/3/library/asyncio.html
[6] https://github.com/pallets/quart
[7] https://swagger.io/
[8] https://vuejs.org/
[9] https://threejs.org/
[10] https://docs.docker.com/compose/
The work was sponsored by the BMBF project SecForCARs and supported by igusGmbH . It was created at SCHUTZWERKGmbH (supervisors Dr. Bastian Könings & Msc. Heiko Ehret) in cooperation with HochschuleKempten (examiners Prof. Dr. Elmar Böhler & Prof. Dr. rer. nat Stefan Frenz).